Pie Chart
Last updated: July 10, 2020
Widget size: 1 x 1, 2 x 1, 2 x 2
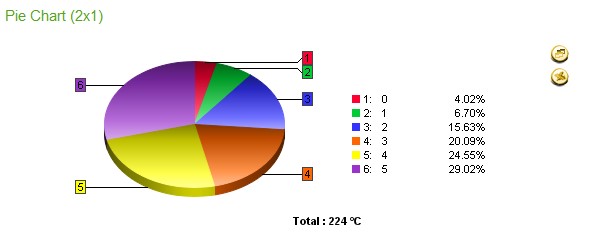
This pie chart (1x1) allows up to 12 points (up to 15 points on a 2x1 and up to 20 on a 2x2 chart) to be displayed. Segments of the chart can be exploded and clicked on to drill down into a graph of data, as well as being viewed as a table, or exported Microsoft Excel.
Customisation
| Value | Default | Comment |
|---|---|---|
| Widget Heading | Pie Graph | Enter the name of the widget as it is to appear in the heading. |
| Display Mode | Graph | Option of Pie or Table for the default view of the widget. When in live view you can still alternate between these views as required. |
| Total Heading | Cost | Edit Total Heading. |
| Units Position | AFTER | Choose for the units to appear before or after the point value. |
| Decimal Places | 0 | 0-5 - the number of decimal places to display. |
| Exploded | No | Yes or No - show segments of pie chart as exploded from the centre. |
| Font Size | 8 | Change Font Size. |
| Graph Size | Can choose graph size to display but will still be within your widget frame (only available when 2x2). | |
| X Heading (x12) | Edit Heading Name (x15 on 2x1 widget, or x20 on 2x2 widget.) | |
| X Drilldown (x12) | x15 on 2x1 widget, or x20 on 2x2 widget. A drilldown to Multiple Charts or Comparison Chart will take the user to the last 7 days of data irrespective of the date being viewed in the widget. Specify the Comparison Chart URL (comparisonChart.jsp) or the Single Charts URL (multipleCharts.jsp) | |
| Scrollable | No | Yes or No. If Yes is selected, it will activate the scroll period option below. |
| Scroll Period | Year | Scroll through the periods by month or year. |
| Start Month | January | Select month to start period from. |
| Pie Side Labels | When <2% | This decides when to display labels at the side of pie segments. If the segments are particularly small, for example <2%, then you may want to explode these segments from being labelled, else the chart will look very cramped, especially on a 1x1 widget. When <2% When <5% All None |
| Ignore Zeros | True | If false then the pie chart will show zero data in the legend and on the segment. Note that null data is never shown. |
| Show Total | Yes | Display Total value under Pie Chart. |
| Display All Org Sites | False | False - Display data on the widget based upon the site selection from the dashboard navigation treeview. True - Ignore any site selection from the treeview, and always display data from all sites within the organisation. |
| URL Target | actionFrame | Decide if you want the drilldown to open in a new window, same page etc. actionFrame - The drilldown opens in the same frame (this is default). _blank - The drilldown opens in a new window or tab. _self - The drilldown opens in the same frame - this is the widget. _parent - The drilldown opens in the parent frame - this is the dashboard. _top - The drilldown opens in the full body of the window - this is the entire application space. |
| Show Legend | NO | Display the legend/key. |
| Refresh Period | No widget refresh | Select a refresh period from the drop down menu from between 15 seconds to 1 hour, or no refresh at all. |